Electro-optics Plus Algorithms Yield Accurate, Continuous Blood-Pressure Readings
What you’ll learn:
- Why standard, cuff-based blood-pressure measurements are insufficient for some desired types of assessments.
- How electro-optical techniques can be used for consistent, real-time data.
- The results achieved under various test scenarios, and what may be “next.”
Blood pressure (BP) is a primary health metric and relatively easy to take. Using a basic pressure cuff (formally called a phygmomanometer) a reading comes back in less than a minute, is noninvasive, requires no consumables, creates no disposables, can be self-administered, and has no risk with minimal discomfort. However, it’s cumbersome, impractical to use while sleeping, and can’t provide a stream of continuous, real-time results. In addition, a series of measurements spaced several minutes apart may be more representative than a single reading.
In contrast, continuous BP monitoring has the potential to greatly enhance patient assessment in “real world,” active situations and, for example, improve hypertension diagnosis and management. For this reason, other techniques have been developed such as electro-optical photoplethysmography (PPG), which is integrated into many consumer wearables. The PPG signal “sees” changes in hemoglobin absorption during each cardiac pulse, providing a relative measure of blood volume changes. However, errors in continuous BP estimation using this approach are generally considered unacceptably high for clinical conclusions.
Other approaches such as tonometry and ultrasound have been explored for cuff-less blood-pressure monitoring. Ultrasound uses acoustic waves to generate images of arteries, then generates a pulse waveform based on the change in diameter of the arteries with each heartbeat. Provided there’s a BP calibration point, blood pressure can then be calculated using physiological models. Ultrasound can penetrate more deeply into tissue than optical techniques, allowing for direct measurements of major arteries.
Tonometry measurements of blood pressure require applanation—application of a known pressure—to the target artery followed by measurement of the intra-arterial pressure wave. Compared to PPG, both ultrasound and tonometry are more sensitive to motion and require precise placement of the probe above the target artery.
The Technical Rationale for Electro-optical BP Measurement
Addressing the need for continuous, noninvasive, accurate BP assessment, a team led by Darren Roblyer, a Boston University College of Engineering associate professor of biomedical engineering, devised a 390-Hz, high-speed Speckle Contrast Optical Spectroscopy (SCOS) system. It measures the cardiac blood flow waveform simultaneously with the PPG signal at high temporal resolution (note that 390 Hz is “high-speed” in the physiological world).
The system uses high-speed multiplexed detection of optical-speckle patterns on the wrist and finger, enabling the extraction of novel features related to BP. While the PPG signal is related to changes in pulsatile blood volume in tissue, it’s insensitive to the changes in blood-flow velocity that occur during the cardiac cycle.
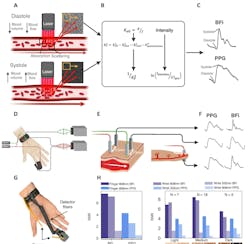
SCOS captures dynamic interference patterns, known as speckle patterns, that are the result of the scattering of laser light on tissue, which is directly influenced by the blood flow. By acquiring speckle images at a sufficiently high sampling rate, SCOS reveals the pulsatile blood flow index (BFi) waveform.
Further, the PPG and BFi waveforms are distinct, which provides opportunities for new features related to cardiovascular health and BP. As an added benefit, the BFi waveform is more resilient to noise during conditions of low tissue perfusion compared to the PPG signal, and it’s less sensitive to temperature and motion.
SCOS System Implementation and Results
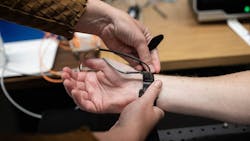
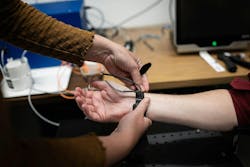
Their finger-attached SCOS system was used to acquire measurements at both visible (532 nm) and near infrared (NIR, 808 nm) wavelengths from 30 subjects before, during, and after a leg-press exercise that was intended to induce changes in BP. The optical signal was brought out to a sensor via optical fibers (Fig. 1).
These two wavelengths were chosen as they target distinct tissue depths. The 532-nm light is more significantly absorbed by tissue and penetrates less deeply—it’s been commonly employed in wrist PPG measurements. In contrast, the 808-nm laser penetrates deeper into the tissue and is the isosbestic point between oxy- and deoxy-hemoglobin absorption, for monitoring of variations in total blood volume irrespective of the individual changes in oxy- and deoxy-hemoglobin concentrations.
A 50:50 fiber-optic splitter was used to illuminate both the finger and wrist with 808-nm light; one of the source fibers was placed on the finger and the other on the wrist. The 532-nm source fiber was positioned one centimeter apart from the 808-nm source on the wrist (Fig. 2).
The unit collected the scattered light using three detector fibers, each corresponding to a source fiber. For finger measurements, the detector was placed on the opposite side of the finger relative to the source fiber to measure light transmission through the finger. For the wrist measurements, the detector fiber was located at distances of 3.0 mm and 4.5 mm from the source for the 532-nm and 808-nm wrist measurements, respectively.
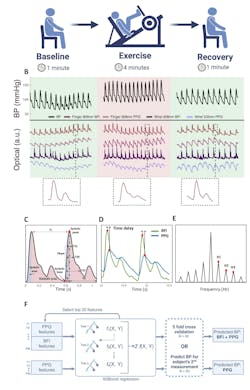
The relatively high time resolution of the collected waveforms provided a variety of shape-, time-, and frequency-domain features that were used in subject-specific machine-learning models to compute continuous BP. The additional information provided by SCOS improved BP estimates substantially compared to PPG alone in both leg-press and other exercises (Fig. 3).
The resulting data was assessed using a variety of statistical and error analyses, in the context of various medically recognized blood-flow and blood-pressure optical/pressure models (Fig. 4). The patient-specific models even provided highly accurate BP predictions even after remeasurement approximately 20 weeks later.
There are many considerations and perspectives when assessing performance, of course. In comparison to PPG alone, SCOS showed a notable 31% improvement in systolic BP estimation when it was integrated into subject-specific machine-learning models. The resulting errors were remarkably low (systolic BP: 0.06 ± 2.88 mmHg, diastolic BP: 0.09 ± 2.14 mmHg) across a wide range of BP variations (systolic BP range: 89 – 284 mmHg). Also important, this improvement was sustained several weeks later within a re-measured cohort indicating highly robust BP predictions.
Beyond Blood-Pressure Measurements
But why stop at blood pressure? The team is looking at other noninvasive, risk-free tests that can be implemented using electro-optics. They’re testing a similar type of optical technology to measure the absorption and scattering of light waves for reading metabolic signals of cancer cells. The concentration and ratio of oxygenated and deoxygenated red blood cells can be used to predict if a tumor is likely to shrink.
Looking further, they’re investigating its use to monitor dialysis for kidney-disease treatment. In addition, the team is in the early stages of creating a device specifically for treating scleroderma (a serious autoimmune disease that causes inflammation and fibrosis of the skin) that can help doctors determine if drugs are lessening internal fibrosis, since nothing of the sort currently exists.
The work is detailed in their paper “Speckle contrast optical spectroscopy improves cuffless blood pressure estimation compared to photoplethysmography” posted at bioRxiv.
Reference
The Brink (Boston University), “Using Light to Monitor Blood Pressure and Track Cancer Treatment Progress.”
About the Author

Bill Schweber
Contributing Editor
Bill Schweber is an electronics engineer who has written three textbooks on electronic communications systems, as well as hundreds of technical articles, opinion columns, and product features. In past roles, he worked as a technical website manager for multiple topic-specific sites for EE Times, as well as both the Executive Editor and Analog Editor at EDN.
At Analog Devices Inc., Bill was in marketing communications (public relations). As a result, he has been on both sides of the technical PR function, presenting company products, stories, and messages to the media and also as the recipient of these.
Prior to the MarCom role at Analog, Bill was associate editor of their respected technical journal and worked in their product marketing and applications engineering groups. Before those roles, he was at Instron Corp., doing hands-on analog- and power-circuit design and systems integration for materials-testing machine controls.
Bill has an MSEE (Univ. of Mass) and BSEE (Columbia Univ.), is a Registered Professional Engineer, and holds an Advanced Class amateur radio license. He has also planned, written, and presented online courses on a variety of engineering topics, including MOSFET basics, ADC selection, and driving LEDs.


