Most RF and microwave analyzers have a superheterodyne architecture that down-converts the input signal to a lower IF, generally using several IF stages at different frequencies. Digital technology takes over following the last IF stage, providing conversion to the frequency domain, filtering, and error correction.
Jason Chonko, applications engineer at Rigol Technologies said, “The Rigol DSA series of spectrum analyzers utilizes a design that incorporates a high first IF and a triple conversion. The traditional superheterodyne design provides a low displayed average noise level (DANL), great selectivity, and stability over time.”
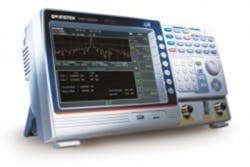
GW Instek’s Jack Hau, product line marketing manager for spectrum analyzers and signal sources at the company, described the 3-GHz GSP-9300 as a swept-tuned spectrum analyzer that also used the superheterodyne receiver structure. The IF is digitally processed and the result shown on the LCD display to reveal the relation between signal frequency and amplitude.
Courtesy of GW Instek
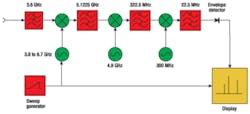
A Keysight Technologies application note describes a 3.6-GHz analyzer design with three IF stages at 5.1225 GHz, 322.5 MHz, and 22.5 MHz, as shown in Figure 1.1 Similarly, Anritsu’s discontinued 8-GHz MS278xA Signature signal analyzer used three IF stages at 9.5 GHz, 1.1 GHz, and 75 MHz.
The operation manual for the Signature analyzer stated, “In the third mixer, the signal is converted to 75 MHz. While the system’s bandwidth up to this point has been maintained at greater than 100 MHz, the signal path is now routed to either a wideband 75-MHz IF section, used exclusively for vector signal analysis, or to a lower bandwidth 10.7-MHz IF section, used for spectrum analysis and low-bandwidth signal analysis. While there are prefilters in the RF/analog section, the task of shaping the IF bandwidth is left mainly to the digital section, where advanced DSP technology can be used.”2
From Keysight’s new N9040B UXA X-Series signal analyzer data sheet, you can determine that the local oscillator’s (LO) 3.75-GHz to 14.0-GHz range is multiplied 1x, 2x, or 4x for the various models: 1x for both 3 Hz to 3.6 GHz and 3.5 GHz to 8.4 GHz, 2x for 8.3 GHz to 13.6 GHz and 13.5 GHz to 17.1 GHz, and 4x for the highest 17.0 to 26.5 GHz range.
Also, because signal bandwidth has become so important, multiple IF input frequencies are listed corresponding to progressively higher signal bandwidths: 322.5 MHz for the narrowband IF path, 250.0 MHz for the 40-MHz bandwidth path, 750 MHz for the 255-MHz bandwidth path, and 877.1 MHz for the 510-MHz very wide bandwidth path. Obviously, this analyzer is more complicated than the example shown in Figure 2; however, the operation of the analog mixer stages with their associated bandpass filters follows the same principles, and a wide-range, high-frequency LO, similar to that in the Signature instruments, is being used by several manufacturers.
Courtesy of Keysight Technologies
Operating a mixer with a zero-IF is called a homodyne or synchrodyne front end in contrast to a superheterodyne system in which a finite IF frequency separates the signal and LO inputs. The National Instruments PXIe-5644R-5646R range of vector signal transceivers uses a homodyne architecture, which the company also refers to as direct conversion.
As explained by NI’s Brian Avenell, chief RF hardware engineer, “Direct conversion down-converts the RF signal directly to baseband, splitting the baseband into [its] in-phase and quadrature-phase components. Each of these baseband signals is digitized separately, so for a given digitizer sample rate, the instantaneous measurement bandwidth is twice the superheterodyne structure that employs only a single-channel digitizer.
“Simplicity in design translates to a more compact-sized product,” Avenell continued. “Because direct conversion uses only a single LO signal, sharing of LOs for multichannel, phase-coherent applications is inherently a simpler solution than [with] multiple conversion superheterodyne architectures,” he concluded.
The homodyne approach also has some drawbacks, most notably problems around DC. Because a signal exactly equal to the LO mixes down to DC, any DC offsets look like a signal in the center of the instantaneous bandwidth. This becomes an even larger issue when successive acquisitions, each with a different DC aberration, are stitched together to achieve a wider span. NI solves the problem by applying equal and opposite offsets that were recorded during a previous self-calibration procedure.
Superheterodyne analyzers
IF frequency selection
Typically, the first IF is positioned above the highest frequency in the basic input range: 5.1225 GHz for a 3.6-GHz upper input frequency in the Keysight 3.6-GHz example and 9.5 GHz for Anritsu’s 8-GHz Signature analyzer. In both cases, only the (LO – signal) mixer output matches the IF.
Ideally, only a low-pass filter is needed to restrict the input range to avoid converting signals above 8 GHz in the Signature analyzer or 3.6 GHz for the Keysight example. The more difficult constraint on the filter is that it should have minimal effect at the highest input frequency but significant attenuation at the IF frequency less than an octave away.
With the first IF higher than the highest frequency input signal, there’s no problem, but what about subsequent mixer stages? The output from the first mixer in the Keysight example ranges from 3.8 GHz to 12.3 GHz using Keysight’s figures. A bandpass filter following the mixer limits this range to 5.1 GHz ±Δ, where 2Δ is the bandwidth of the filter. Without the filter, the 4.8-GHz second LO could mix with first stage frequencies around 4.5 GHz (rather than the intended 5.1 GHz) to produce a 322-MHz output. Similarly, the bandpass filter following the second mixer must block frequencies below about 300 MHz to avoid unintended mixing from the third LO.
The bandwidth available at the output of the final-stage bandpass filter is the value that compares with 802.11ac’s 160 MHz or your application’s requirements. It’s at the final stage that the output is digitized and DSP techniques can be applied, for example, to implement resolution bandwidth (RBW) filtering and apply various correction factors.
Anritsu’s Eric Hakanson, a senior product manager, discussed the company’s handheld analyzer designs, “Instead of a swept LO, this architecture uses a fully synthesized LO, controlled by a DSP processor…. To save cost [and] improve phase noise… the frequency resolution of the LO is distributed among multiple stages. The first LO has relatively coarse resolution of approximately 100 kHz, and the second LO has finer resolution of <10 kHz. Spur avoidance… also is possible with this scheme.”
What happens if an IF is chosen that is lower and considerably smaller than the band of frequencies to be converted? The Keysight example addresses input signal frequencies above 3.6 GHz with an IF at 322.5 MHz. Because the LO range is as large as the input frequency band, and the values are much greater than 322.5-MHz, both (signal – LO) and (LO – signal) mixer outputs are generated. The solution is to add a preselection filter ahead of the mixer.
Preselection
For high-frequency analyzers operating with a relatively low-frequency IF, a preselection input filter tracks the LO. The filter is offset from the LO by the value of the IF center frequency and only allows signals within its bandwidth to be presented to the mixer. The preselector typically is based on YIG technology and has a bandwidth of about 50 MHz—significantly less than the IF. This means that the upper or lower mixer output can match the IF frequency, but not both, which eliminates images. A high-frequency analyzer can be operated without a preselector if the input signal is well controlled so that images can be identified and ignored.
Switched preselection filters provide a similar function to a YIG filter but add their own advantages and complications. Although a YIG filter has limited accuracy, adds noise, and changes bandwidth with center frequency, it tracks the LO over a wide tuning range. In contrast, switched preselection filters typically have fixed suboctave ranges, and a number of them are needed to cover a large frequency range. Nevertheless, switched filters not only allow images to be avoided, but also support the very large signal bandwidths necessary today.
The Tektronix Component Solutions group has developed the TSFB-900A switched filter bank that covers 8.0 GHz to 22.0 GHz in nine channels. NI’s PXIe-5693 has 13 filters ranging from 20 MHz to 7 GHz. Architectures with multiple mixers and a wide-range LO can take advantage of filters like these.
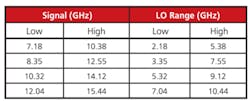
Because the filter passbands are relatively narrow, and you have control of the LO range, images are easy to avoid. If a 5-GHz IF is assumed, then Table 1 shows the LO ranges needed to provide the (signal – LO) mixer output when working with the first four Tektronix filters. Higher bands can be addressed by doubling the LO frequency as done in Keysight’s UXA analyzer or in NI’s PXIe-6505 downconverter.
Tek has implemented switched filters in the company’s RSA5000 and RSA6000 Series of real-time spectrum analyzers (RTSAs). Matt Maxwell, product manager for Tektronix RTSAs, explained, “When doing over-the-air monitoring, either for regulatory work or electronic warfare, it is important to know whether the signals you are looking at… are coming over the air or being generated within the analyzer. Other spectrum analyzers would bypass the YIG preselector when doing work above 3.6 GHz or even 8 GHz, depending on the manufacturer. The RSA5000 Series always uses the image-free architecture, so you can have confidence that you are not looking at ‘ghost’ signals generated inside the IF of the analyzer.”
Anritsu’s Hakanson added size, weight, and power savings to the list of reasons for not using a YIG preselector. He explained, “The output of the switched filter bank may go to one of several different mixers. This architecture allows using mixers optimized for different frequency ranges, rather than requiring one very expensive mixer that covers all frequencies. This is a natural combination with the switched filter bank, as there is already a switch there, which also can be used to direct the signal to a specific mixer. Note that there is not a one-to-one match between bands and mixers—several bands may use one mixer, for example.”
FFT
Darren McCarthy, aerospace and defense technical marketing manager at Rohde & Schwarz, commented, “Most of the innovation and advantages of modern signal analysis have been built on the FFT-based receiver/signal analyzer. One recent advancement has been the real-time persistence display that enables users to see very fast changes to signals in the frequency domain.”
Anritsu’s Patrick Weisgarber, business development manager, discussed a related advantage of FFT techniques. A fundamental flaw in traditional swept-tuned analyzers is that they necessarily miss activity in one part of the spectrum while sweeping another part. In contrast, he said, “Advanced FFT technology… allows the Anritsu signal analyzers to see signal behavior in the time domain that is missed by a sweep-type spectrum analyzer that relies solely on the frequency domain.”
Initially, FFT-based filters were introduced as a way to achieve shorter sweep times when using narrow RBW IF filters. Traditional analog filter components such as capacitors and inductors store energy and have high values at low RBWs. This means that narrow RBW analog filters can’t be swept quickly without distorting the signal being measured. The solution is to implement these filters digitally via FFT techniques.
Rigol’s Chonko said that the company’s DSA series of spectrum analyzers uses a fully digital IF section, which “…has allowed us to create an EMI-specific design…. In addition, there is a firmware upgrade option that alters the normal 3-dB filter shape to a 6-dB RBW filter shape typically used in EMI applications, [and adds] a quasi-peak detector… FCC RBW bandwidths of 200 Hz, 9 kHz, and 120 kHz as well as pass/fail limit lines.”
McCarthy at R&S explained that three types of the company’s instruments were based on FFT techniques: signal and spectrum analyzers, EMI test receivers, and monitoring receivers. EMI receivers in particular have features not necessarily found in general-purpose analyzers. He listed the following:
- additional RF overload detection to warn users if the measurement signal may be compressing the receiver RF mixing stages (a typical spectrum analyzer may only have IF overload detection and be blind to front-end RF overload);
- additional and predefined banks of preselection filters enabling standards-based pulse-protected inputs;
- displays and functions such as log frequency, limit lines, transducer factors, and marker functions;
- product-specific testing standards (medical devices, ISM equipment, computers, etc); and
- display functions to aid in the debug of EMI emissions such as real-time persistence display and spectrogram.
For Tek’s RSA6100, “The RBW shape is achieved by applying an optimized window function to the time-domain signals before performing a Fourier transform. RBWs are specified by their 3-dB bandwidth and 60-dB: 3-dB shape factor, in the same fashion as an analog implementation. In general, the shape factor of the digitally implemented filter is lower (sharper) than an analog implementation, yielding easier resolution of closely spaced signals of widely different amplitudes.”3
In contrast, reference 3 also describes Tek’s RSA3000 Series RTSA. “In spectrum mode, the result of a windowed FFT is convolved with a RBW shape to yield spectrum traces with a specified RBW, similar to an analog spectrum analyzer. This process yields a slightly wider shape factor of approximately 5:1, compared to 4.1:1 for the RSA6100.”
Windowing is required before performing a Fourier transform because the discrete Fourier transform assumes a periodic function. In general, acquired data is not periodic, and even if it were, the acquired data may not represent an integer number of cycles. Windowing in the time domain smoothly reduces the value of the first and last data points to zero, forcing periodicity and eliminating the spectral leakage that otherwise would result.
Unconventional techniques
Signal Hound’s CEO Bruce Devine explained that, by minimizing the amount of RF hardware and concentrating on innovative software algorithms, his company’s USB-powered PC-based spectrum analyzers provide good performance while remaining very economical. He said, “For our economy USB-SA Series, we use single-conversion superheterodyne receiver architecture with dual IFs…. We use a software-based algorithm that combines two traces from two unique combinations of LO and IFs and mask them together to produce the final, image-rejected trace. This works well for narrowband signals.”
A similar two-measurement enhanced digital image rejection technique was described by Keysight’s John Stratton at this year’s Autotest conference. For the approach to work well on quickly changing signals, a fast-settling LO and switching are required to capture the signal twice before it changes significantly.4
Further Considerations
Although many spectrum/signal analyzers are available, there also is a long list of parameters against which they can be compared. Do you need a real-time analyzer? What are the advantages of a dedicated real-time instrument vs. an analyzer that offers an optional real-time mode in addition to its conventional swept-tuned operation? And, how high a frequency do you need to work with?
These are just some of the questions you need to answer before getting into the very detailed specifications available for professional-grade analyzers. FFT techniques have greatly improved performance but also have contributed to complexity in today’s mix of swept-tuned, real-time, and hybrid instruments.
References
- Spectrum Analysis Basics, Keysight Technologies, Application Note 150, Publication 5952-0292, August 2014.
- Series MS278XA High Performance Signal Analyzer Operation Manual, Anritsu, P/N 10410-00252, Revision C, April 2006.
- Real Time Spectrum Analyzer Fundamentals, Tektronix, 2009, p. 24.
- Stratton, J., “Possible alternatives to overcoming speed limitations using synthetic instruments signal analysis architecture,” Autotest Proceedings, 2014, pp.150-152.
For more information
Anritsu
GW Instek
Keysight Technologies
National Instruments
Rigol Technologies
Rohde & Schwarz
Signal Hound
Tektronix


