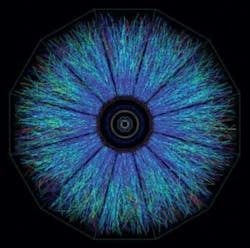
When gold ions traveling close to the speed of light collide, the resulting stream of quarks and gluons can appear as shown in Figure 1, a display generated by the Brookhaven National Laboratory’s STAR detector. A temperature of about four trillion degrees Kelvin is associated with the collisions1—not something most engineers encounter very often.
In fact, the Brookhaven researchers didn’t measure the temperature but instead derived it from the energy of the particles. In plasma physics, it’s common to equate temperature to energy
Courtesy of Brookhaven National Laboratory
Much more often, temperatures need to be measured that are within the range of readily available thermocouples (-200°C to +2,000°C), RTDs (-200°C to +800°C), and thermistors and integrated circuit temperature sensors (-50°C to +150°C). Noncontact infrared temperature measurement is useful up to 2,000°C or 2,500°C, depending on the manufacturer and model. Infrared temperature measuring cameras have become popular maintenance tools because they quickly display hotspots within otherwise correctly operating industrial processes.
Thermocouples
The Seebeck effect and Seebeck coefficients describe the relationship between voltage and temperature in conductors. When a temperature difference exists along a conductor (material A), a corresponding voltage also exists. If a different type of wire (material B) is used to connect a meter between the hot and cold ends of the conductor, a voltage can be measured that is proportional to the difference between the Seebeck coefficients of the two materials.
Typical thermocouples (TCs) are made from two different conductors, one with a large positive Seebeck coefficient and the other with a large negative coefficient—for example, iron at +18.9 µV/°C and constantan at -35 µV/°C in a type J TC. Test equipment intended for use with TCs includes one or more isothermal so-called cold junctions (CJs) where the connections are made from the special TC wires to copper wires leading to the rest of the circuitry. Because both copper junctions are at the same temperature, their contributions cancel.
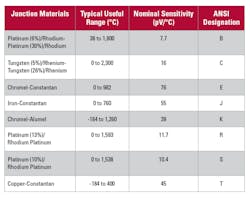
Table 1 lists the sensitivities for a number of popular TCs. All of the values are measured relative to platinum at 0°C. As the table shows, thermocouples generate very small voltages, which place constraints on data acquisition systems, connections, and layout.
Source: Analog Devices
In general, the temperature-voltage relationship is nonlinear, and to deal with it, high-order polynomials have been developed3 that can be applied in software. For the popular J-type iron-constantan TC
where V is in millivolts and t is in °C.
These equations are called ITS-90 inverse polynomials because they determine temperature from voltage. ITS-90 direct polynomials calculate the voltage that a given type of TC will generate at a temperature T.
ITS-90 refers to the International Temperature Scale of 1990 published by the Consultative Committee for Thermometry of the International Committee for Weights and Measures. In spite of the wording of the title, this material is not a scale but rather references to be used in calibrating temperature measuring equipment. For example, the freezing points of several metals are listed as physical standards that can verify the accuracy of temperature measurements. TC tables and polynomials also are included in this material.
To make accurate temperature measurements, instruments first determine the isothermal junction temperature via a thermistor, integrated temperature sensor, or resistance temperature device (RTD) mounted on the CJ. This temperature then is converted to the equivalent voltage that the TC would develop at that temperature. One way to do this is to approximate the 0°C to 50°C part of a TC’s output as a straight line with a slope of m-µV/°C. For the J-type TC, this value is 51.71 µV/°C. Alternatively, a direct polynomial could be used at the expense of computation complexity and time. The voltage that the TC would generate at the CJ temperature is added to the TC output measured at the CJ. The total voltage now represents the TC output relative to 0°C. Finally, the TC temperature relative to 0°C is determined by using the total voltage as the input to the appropriate ITS-90 inverse polynomial.4
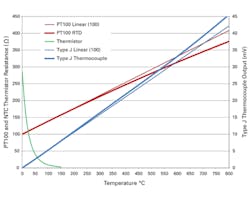
Figure 2 shows the voltage output from a type J TC over the range of 0°C to 800°C as computed using an ITS-90 direct polynomial. The curve is very slightly in error at the highest temperatures because a different ITS-90 equation should be used for temperatures from 760°C to 1,200°C.
In fact, the two equations do not produce exactly the same result at 760°C. The disagreement highlights the difficulty in accurately computing thermocouple output voltage or temperature over a very wide range. Instead, as discussed in one article, it’s more accurate to use a polynomial that describes performance over a narrower range.4
Bob Judd, director of marketing at United Electronic Industries, confirmed the continuing relevance of TCs. He said, “We still see temperature measurement dominated by the ‘big three’—thermocouples, RTDs, and thermistors—with popularity basically in that order. Although they carry the baggage of CJ errors and compensation, the low cost, wide temperature range, and reasonable accuracy of TCs keep them at the top of the list, at least with our customers.”
UEI’s Model DNA/DNR-AI-212 12-channel fully isolated TC input board features an ADC per channel with up to 1,800 samples/s per channel and an input resolution of 7.6 nV at a gain of 16. CJ compensation is via an Analog Devices’ ADT 7420 16-bit integrated circuit temperature sensor with ±0.25°C guaranteed accuracy. Because the sensor provides a linear output, CJ compensation is simplified.
Nevertheless, TCs are in no way a one-size-fits-all commodity. Dewetron’s president Grant Smith cited ballistic testing in which designers need to measure the rapid rise in the temperature of a gun barrel when the gun is fired. There are very small TCs that provide the necessary high bandwidth. According to Smith, “When it comes to TC bandwidth, mass is the driving factor.… These specialized sensors are very thin, sometimes thinner than a human hair, and they offer extremely high bandwidth.”
Dewetron’s HIS-STG signal conditioner has a 2-MHz bandwidth and can be directly connected to such a TC. The HIS-STG sensitivity starts with a 5-mV full-scale range, and linearization can be done in software. If a thermocouple adapter with CJ compensation is used, the bandwidth reduces to about 200 kHz, which still is a high value for a TC application, according to Smith.
The HIS-STG is galvanically isolated to ±350 V DC, which protects the measurement system from ground faults, ground loops, and electrical noise. Model DAQP-STG is similar but with 300-kHz bandwidth instead of 2 MHz.
Aaron Lee, product marketing manager, data acquisition at Yokogawa Corp. of America, described a TC application in heavy industry. He said, “Direct reduction iron (DRI) is one of the processes used to reduce oxygen from iron oxide pellets for steel plants. More than 90% of DRI processes use heated LNG as process gas…. One of the major problems faced by the user is frequent replacement of thermocouple cables due to the high ambient temperature and vibration in the process. Wireless temperature measurement was introduced to eliminate [this problem.]…. A highly reliable and fully redundant wireless system allowed multiple temperature transmitters to be deployed across the entire plant. Wireless transmitters up to 100 m away were able to send process data back to the central gateway.”
Benefits of the wireless approach included less downtime, operational cost reduction, and overall simplification. Less wiring and fewer junction boxes and cable racks were required. Performance also improved because TC cable degradation was avoided and noise interference was reduced.
Yokogawa’s YTMX580 temperature transmitter accepts up to eight thermocouple or RTD inputs, updating measurements as quickly as once per second or as slowly as once every hour. The transmitter is ISA100 Wireless compliant and compatible with the company’s YFGW410 field wireless management station, the YFGW510 field wireless access point, and the YFGW710 field wireless integrated gateway.
Data Translation’s president Peter Anderson discussed the challenges associated with “… multi-cell battery testing, which requires that the temperature channels be isolated from each other.” The company’s MEASURpoint instrument features ±500-V channel-to-channel and channel-to-ground galvanic isolation with a 24-bit ADC per channel. The models DT9874 (USB) and DT8874 (Ethernet) have an independent CJ compensation circuit per channel and sample each of up to 48 channels at a maximum 10-Hz rate.
VTI Instruments also has developed a multichannel voltage/TC instrument. The company’s Chris Gibson, business development manager, mechanical test, explained that because of the uncontrolled environment in large engine test cells, instrumentation traditionally has been placed in control rooms. He said, “The drawback with this approach is that this leads to extended maintenance cycle times and long cable runs carrying low-level signals, which are subject to noise. Placing ruggedized instrumentation close to the test article overcomes many of the drawbacks … but can lead to less accurate data.”
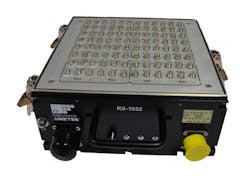
The ruggedized Model RX1032, shown in Figure 3 with the protective top cover removed, is a 32-channel IP65-rated instrument with CJ compensation to achieve typical 0.2°C TC accuracy. Each input is sampled at up to 1,000 samples/s, and a selection of programmable Bessel and Butterworth filters is provided. The RX1032 conforms to MIL-PRF-28800F for shock and vibration and operates from -40°C to +71°C (reduced accuracy) or 0°C to +50°C (full accuracy) and at altitudes up to 4,600 m.
Courtesy of VTI Instruments/Ametek
RTDs, thermistors, and IC temperature sensors
As the name implies, RTDs change resistance with temperature—so too do thermistors. The major difference between the two types of sensors is the material used for each. Thermistors are small pieces of semiconducting material that exhibit large changes in resistance for a small temperature variation. Thermistors are much more sensitive to a given temperature change than RTDs, but they also have a much smaller temperature range and a very nonlinear exponential response.
The resistance curve for a 100-Ω Vishay NTCLE100E3101 thermistor is shown in Figure 2, and the high sensitivity compared to that of either an RTD or a TC is easy to see. Negative temperature coefficient (NTC) thermistors change resistance as an exponential function of absolute temperature. For the Vishay thermistorwhere: T = degrees Kelvin (°C + 273.15)RTDs are based on platinum film or wire, both of which have precisely known and nearly linear characteristics that support highly repeatable and accurate measurements. The resistance of a PT100 RTD that measures 100 Ω at 0°C is shown in Figure 2. In contrast to the J type TC output voltage that increases at a faster rate as the temperature increases, the PT100 resistance increases more slowly with increasing temperature. From a Pico Technology datasheet, the ITS-90 equation relating resistance to temperature for one of the company’s PT100 RTDs is
As an example of RTD use, Data Translation’s Anderson said “… the MEASURpoint instrument offers RTD measurements with typical offset specifications of ±0.003°C for PT1000 RTDs.” He concluded that this level of accuracy is increasingly needed in today’s test environment.
Accurate resistance measurements often involve four-wire Kelvin connections in which two wires supply a known current and the other two measure the resulting voltage. Self-heating can be a problem with RTDs because of the sense current: a 1-mA current produces 100 µW of heat in a PT100 RDT. Some increase in temperature will occur but can be minimized if the mass of the DUT is large and the RTD-to-DUT mounting has a low thermal resistance.
Nevertheless, RTDs and thermistors are relatively easy to use because they do not have a TC’s need for CJ temperature correction. It is important, however, to notice that RTDs are calibrated relative to 0°C but thermistors are referenced to 25°C. This is why the thermistor curve in Figure 2 crosses the 100-Ω line at 25°C. In contrast, the PT100 RTD measures 100 Ω at 0°C.
IC temperature sensors are replacing thermistors and RTDs in many applications within the -50°C to +150°C range because of their ease of use. The output is linear and accurate within a small fraction of a degree, so it can be used directly or scaled, but there’s no need for linearization using polynomials or even linear approximation. Analog output sensors can have either a voltage or a current output. A current output makes multiplexing especially simple and remains accurate over long cables.
Infrared cameras
Rather than measure one point on a DUT with the possibility of changing its temperature because of the sensor that has been attached, why not view thousands of points at the same time without contacting the DUT? As Tony Shockey, thermography services manager at Fluke, commented, “An IR camera shows you a heat map of the entire component or area of interest. You can see not only temperature changes over time, but they can help you to verify and validate power consumption for systems and failure analysis.”
Fluke’s Model TiX1000 Infrared Camera has a basic 1,024- x 768-pixel resolution with a SuperResolution mode that boosts this by a factor of four to 2,048 x 1,536. In addition, the EverSharp multifocal recording capability creates a sharp image of all the objects in the frame by combining images acquired with a range of focal distance settings. The camera includes built-in GPS for georeferencing, a digital visible light camera, text annotation, and voice annotation via an integrated microphone.
Flir Systems also manufactures a range of thermal imaging cameras. The datasheet for the company’s Model T1020 “T1K” highlights some of the more unusual features of this camera with a 1,024 x 768-pixel sensor. A special UltraMax processing technique, similar to Fluke’s SuperResolution mode, provides up to 4x image resolution while reducing noise. And, the patented MSX capability allows you to see visible detail and read text without impacting measurement accuracy. In common with some Fluke cameras, the T1020 has a rotating optical section that can be aimed at the area to be measured while maintaining the display in a convenient position for the user.
Emissivity is a topic that distinguishes a trained thermographer from an untrained person with a thermal camera. All materials emit energy proportional to their temperature but, as a thermal imaging blog from Fluke states, “… most shiny metals emit inefficiently…. Most nonmetal surfaces are much more efficient emitters, so it’s easy to make a direct connection between what they radiate and their surface temperature.” The blog suggests painting or adding a layer of tape to shiny metal surfaces before trying to measure their temperatures. The author concludes, “Radiometric temperatures of bright metal surfaces will be unreliable. Use high-emissivity targets whenever possible.”5
Both Fluke and Flir cameras accept emissivity corrections over a wide range. The Flir T1020 datasheet specifies a 0.01 to 1.0 range and states that alternatively the value may be provided from a materials list. The datasheet also notes that measurement corrections are based on emissivity, reflected temperature, relative humidity, atmospheric temperature, object distance, and compensation for an external IR window if one is used.
Accuracy for the two cameras is similar: ±2°C or 2%, whichever is greater, at 25°C for the Flir T1020 and ±1.5°C or 1.5% for the Fluke TiX1000. Both companies offer optional lenses that adapt the cameras to wide-angle, telephoto, or macro applications.
Fiber optics
Fiber Bragg gratings (FBGs) have become popular sensors for measuring temperatures at many points on large structures or distributed over a long distance. The grating is formed by exposing a short section of photosensitive optical fiber to a periodic light pattern. The fiber’s refractive index is permanently changed according to the light pattern.
In use, an FBG reflects only a very narrow band of light wavelengths while passing all others. This means that a series of gratings made with different pattern spacings can be strung together. Each will reflect only a unique frequency of light. Because you know the wavelength range of each grating, you can associate the reflected signal from each grating with a particular physical location. For example, you could monitor the temperatures at many points inside a long mine tunnel or at many locations around a large biochemical vat.
Unfortunately, Bragg gratings are sensitive to both strain and temperature, so to measure only temperature, the grating must remain unstressed. One way to accomplish this is to use packaged FBGs in which the package protects the grating from strain.
National Instruments’ Sunaina Kavi, product marketing manager—embedded systems, cited large power transformer internal temperature monitoring as a typical FBG application. She said, “About 30% of power transformers fail due to degraded insulation and overloading. Prolonged operation at elevated temperatures degrades the winding insulation and dielectric coolant…. FBGs are ideal for monitoring the transformer’s internal temperature because the sensor depends on optical measurements—not electrical—and is therefore immune to EMI and high voltages.”
According to an article on the NI website, the company’s PXIe-4844 Optical Sensor Interrogator “… uses a Fabry-Perot tunable filter to create a fast, high-power sweeping laser … that concentrates energy in a narrow band, providing a light source with an excellent SNR.” When the sweeping laser frequency matches that of one of the FBGs, light is reflected and measured by a photodetector. The light’s frequency indicates the temperature change a particular FBG is experiencing.6
As an example, HBM’s FS63 range of FBG temperature sensors has a typical sensitivity of 10 pm/°C, so when used with NI’s PXIe 4844 with 1-pm accuracy, a 0.1°C change should be detectable.
Accuracy
All temperature measuring sensors are limited in some way—the temperature range they cover, their cost, the complexity associated with CJ compensation, or the environments in which they can be used. A comment by UEI’s Judd also applies. He said, “We often find customers have an unrealistic expectation of their overall system accuracy because they don’t realize the error inherent in the sensor itself. It doesn’t help us or our customer if they expect 0.2°C accuracy based on our measurement system specifications but use a sensor that’s only accurate to 1°C over the measurement range.”
References
- “’Perfect’ liquid hot enough to be quark soup,” Department of Energy/Brookhaven National Laboratory, Science Daily, Feb.15, 2010.
- Mohr, Dr. P. J., and Taylor, Dr. B. N., “The NIST Reference on Constants, Units, and Uncertainty,” NIST, 2015.
- NIST ITS-90 Thermocouple Database, 2014.
- Klopfenstein, R. Jr., “Software Linearization of a Thermocouple,” Sensors, December 1997.
- Snell, J., “Emissivity: Understanding how it affects your thermal images,” Fluke, Thermal Imaging Blog, September 2010.
- Fundamentals of Fiber Bragg Grating (FBG) Optical Sensing, National Instruments, White Paper, January 2016.
For more information


