Swept, vector, and real-time are a few of the terms being used to describe today’s signal analyzers. They help to identify major changes in spectrum and signal analyzer capabilities that have occurred during the past few decades. Largely driving these advances have been high-performance ADCs and microprocessors, which control where an analyzer’s analog circuitry ends and how the subsequent digital signal processing is achieved.
Most RF and microwave analyzers use a super-heterodyne analog front end that includes attenuation, preselection, and multiple stages of mixing with appropriate local oscillators and amplification. At the output from the last mixer, the selected band of frequencies has been downconverted to be centered upon the final IF frequency.
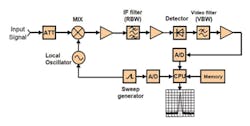
A traditional swept-tuned spectrum analyzer sweeps the LO through a continuous range of frequencies—the span. A filter in the IF circuitry sets the resolution bandwidth (RBW)—the closest frequency spacing of two signals that still allows separate detection. A detector, video filtering, and a display complete the analog signal path. As shown in Figure 1, signal recording and display were areas where digital techniques first appeared. Only amplitude information was available.
Courtesy of Anritsu
Some analyzers have moved the ADC further forward while retaining most of the analog circuitry up to the final IF. These products are described as having a digital IF in which a digital section following the ADC accomplishes log amplification, RBW filtering, envelope detection, video filtering, averaging, and display scaling.
The digital processing mimics the analog functions in a traditional swept spectrum analyzer, and the FFT usually is not involved. A digital IF eliminates virtually all of the drift and uncertainty associated with conventional IF circuitry. On the other hand, the instrument still is a swept-tuned analyzer and essentially deals with one frequency at a time. This means that it cannot catch transients or even longer signal bursts that happen to fall in part of the spectrum that at that moment is not being swept.
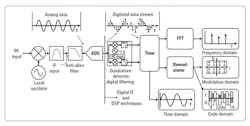
In a vector signal analyzer (VSA), the ADC also is far forward, as shown in Figure 2. However, the processing following the ADC is different. A quadrature detector develops I and Q data streams that subsequently are used in demodulation. And, the FFT or a similar transform is used to generate the complex spectrum that corresponds to a block of time-domain data. Windowing and additional processing ahead of the FFT achieve the user-selected RBW.
Courtesy of Keysight Technologies
FFT-based signal analyzers are particularly attractive because the FFT effectively performs parallel processing rather than operating on one frequency at a time. This means that operation can be much faster than with a conventional instrument. Importantly, because it works with blocks of time-domain data, there’s a much better chance that transients will be captured.
Real-time signal analyzers have many of the same characteristics as VSAs but with a major difference. The design makes sure that the time taken to process a block of data is shorter than the time taken to acquire the data. This means that an FFT can be computed and the necessary pre- and post-processing performed before the next block of data is ready. And, triggering can be based on the signal’s spectrum, allowing the decision to acquire a particular block of data to be made on the fly.
Nevertheless, because of the finite ADC sampling rate, the windowing required ahead of the FFT, and the time needed to compute the FFT, there are limits to performance. For example, as described by Keysight Technologies’ Cherisa Kmetovicz, product manager, communications measurement solutions, “The [models] UXA and PXA take advantage of a wideband digital IF board to support 255- or 510-MHz bandwidth utilizing a Keysight proprietary 2.4-Gsample/s clock rate ADC with 14 bits of resolution…. Real-time spectrum analysis support of the full 510-MHz digital IF bandwidth enables true gap-free capture to confidently see the behavior of dynamic signals with durations as short as 3.51 µs at 100% probability of intercept.”
Areas of improvement
LO and reference
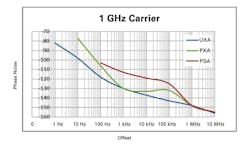
RF and microwave analyzers often use a PLL-based frequency synthesizer as the LO. As shown in Figure 3, which compares the phase noise performance of three Keysight instruments, PLLs create a pedestal region in the phase noise plot. To eliminate this restriction on phase noise reduction, Keysight has used direct digital synthesis (DDS) in the N9040B UXA signal analyzer. A company backgrounder explains, “The shape and corner frequency of a phase noise pedestal are governed by the PLL’s loop-filter characteristics, which are sometimes adjustable by the analyzer as a way to optimize phase noise performance in the most important offset region for a measurement…. For very wide offsets, a PLL is used [in the UXA] along with the DDS to get a lower phase noise floor….” The backgrounder also discussed the UXA’s new frequency reference section that “… has been optimized to take advantage of the DDS characteristics and improve phase noise performance, particularly for frequency offsets narrower than 100 Hz.”1
Courtesy of Keysight Technologies
Multichannel phase-coherent RF measurement systems, such as used with phased-array radar, direction finding, beam steering, and MIMO development also are dependent on the LO’s characteristics. The capability to share the LO and other timing signals across multiple modules was discussed by National Instruments’ Shivansh Chaudhary, RF product marketing engineer. He said, “The NI PXIe-5668R 26.5-GHz VSA can be configured to support up to four phase-coherent measurement channels in a single PXI system. This [configuration] supports phase drift of less than ±1 degree across a 500-MHz to 26.5-GHz frequency range.”
Chaudhary continued, explaining how this level of performance was achieved. He said, “System calibration first requires the measurement of phase and magnitude response between multiple channels with reference to a master channel. Once the raw system response is measured, the calibration routine then constructs a custom equalization filter and downloads it to the instrument’s FPGA. As a result of calibration, the phase and magnitude offsets between channels of multichannel RF instruments are corrected not only at the center frequency, but across the entire RF bandwidth of the instrument.”
The use of a custom equalization filter to correct a channel’s frequency and phase errors is not new. When previously applied in a number of oscilloscopes, the approach linearized phase response, which improved pulse-response fidelity. And, in some cases, a custom filter extended the 3-dB bandwidth.
The technique also is used by Anritsu. As described in an application note, “The digitize function records sampled RF input signals in waveform memory as I/Q data … [which] can be used by the [built-in] VSA function and by simulation tools.” The note further explains that because of errors introduced during downconversion, “… error calibration is necessary in the signal analysis. The MS269xA [instruments] record data as absolute values by calibrating measurement instrument internal errors in real time…. Amplitude and phase characteristics can be calibrated in hardware using a reverse-characteristics FIR filter.”2 Because of this correction process, the note claims that “Captured data … can be used with customers’ analysis tools/programs without [requiring] expert calibration knowledge.”2
Integration
Anritsu’s Tom Brinkoetter, business development manager, discussed some of the benefits made possible by combining signal generation and analysis in the same instrument. He said. “The MS2830A and MS2690A spectrum/signal analyzers incorporate multiple instruments in one package. They integrate a wideband DC to 6 GHz swept spectrum analyzer for a wideband view of the spectrum; a signal analyzer with up to 125 MHz of spectrum capture bandwidth; a vector modulation analyzer to view modulation quality of most RF signals, including cellular, public safety, Wi-Fi, IoT, and others; and a vector signal generator to playback captured spectrums and provide precision signals for receiver testing. The one-package approach simplifies the task of converting rarely received signals into recurring events, as just a few front panel button presses are necessary to perform tests.”
Custom semiconductor integration and proprietary manufacturing techniques have been used to provide 40-MHz capture bandwidth in three new or upgraded Tektronix USB-based real-time spectrum analyzers. As described by Varun Merchant, technical marketing manager at the company, “The RSA500A is a battery-powered portable USB spectrum analyzer for field use, and it [has an optional] tracking generator. These [analyzers] are available in frequency ranges up to 3 GHz or 7.5 GHz and … address applications such as spectrum management, surveillance and monitoring, and field [tests] and maintenance.”
The RSA600A has similar specifications but is intended for use in a lab so it does not have the RSA500A’s ruggedized case or its battery. The third instrument, the RSA306B, is an upgraded version of the original RSA306 with a frequency range from 9 kHz to 6.2 GHz. Typical accuracy in the B version is ±0.8 dB up to 3 GHz compared to the earlier instrument’s ±1.25 dB, and the spurious-free dynamic range has been improved from 50 dBc to 60 dBc.
All three analyzers guarantee 100% probability of intercepting (POI) signals at least 100 µs in duration. And, each analyzer really is three instruments in one: a spectrum analyzer, a VSA, and a real-time spectrum analyzer. In particular, Merchant emphasized that “Span, resolution bandwidths, and trace points are selectable by the user similar to a standard spectrum analyzer instead of needing to learn a new set of operating controls.”
Although no details of the signal processing are available, a few clues are given in a Tektronix primer3 on overlapping FFTs. It states, “The mathematics of an FFT requires that the number of samples used must be an exact power of 2…. There are some discrete time transforms that are not as limited as the FFT. One such alternative is the Chirp-Z transform (CZT). The CZT can provide 1,024 output points with only 200 or 300 input points and under some conditions may be useful with as few as 12 or 13 input points…. Since the CZT can use a different number of input samples depending on analyzer settings such as span, RBW, type of windowing filter, etc., the maximum [overlap] scale setting will also be dependent on these analyzer settings.” The CZT’s flexibility is a major factor that allows some real-time spectrum analyzers to be operated, as Merchant said, as a standard spectrum analyzer.
The three recently introduced USB-based instruments depend heavily on the SignalVu-PC software features for output. Merchant explained that partitioning a signal analyzer’s functions to take advantage of today’s fast PCs “… helps Tektronix be a more application focused provider of test equipment because we can spend more time and resources on developing the critical software.” The free version of SignalVu-PC includes 17 measurements such as spectrogram, spectrum, occupied bandwidth, and AM, FM, and PM. Application-specific node-locked or floating licenses are available for 802.11, P25, and LTE analysis, among others.
SignalVu-PC clearly is a focus of Tektronix development activity. This software provides the backend processing for almost any time-domain sampled data stream and is equally applicable to high-end real-time analyzers, windows oscilloscopes, and the three USB-based analyzers discussed here.
Bandwidth and speed
Rohde & Schwarz has announced the FSW-B512R platform extension to the FSW Series signal analyzers. According to the company’s Darren McCarthy, technical marketing manager, “The R&S FSW-B512R provides 512 MHz of real-time bandwidth with >1 million FFTs/s and a 100% POI of <1 µs. The combination of bandwidth, persistence display, and analysis enables increased capabilities in the analysis of hopping signals such as radar and radios, detection of unwanted interferers, and assurance of proper signal behavior. Authorities use real-time spectrum analysis for frequency bands to detect unwanted interferers or signals that are not allowed, and the >500 MHz of real-time bandwidth enables entire spectrum bands to be analyzed.”
As well as real-time functionality, a series of options further extends the applications that the FSW analyzer can address. As an example, for the radar industry, FSW-K6/K6S adds pulse measurements and an extension for time side lobe measurements including correlation to be done on user-defined signals in K6S. FSW-K60/K60C/K60H supports transient measurements and extensions for chirp and hopping signals, and FSW-K7—analog modulation analysis AM/FM/φM—can be used to analyze newer CW poly-phased (poly-code) signal transmit quality on common low-probability intercept radar signals.
In addition, the FSW85 model has the capability to tune from 2 Hz to 85 GHz in a single box without the use of external mixers and provides a calibrated and integrated analysis of up to 2 GHz, which is essential for emerging market needs for 5G wireless and automotive radar.
Although the R&S ESW Series EMI test receivers are in a different class than signal analyzers, they accomplish many of the same measurements but specifically for EMI applications. Partly because EMI compliance measurements emphasize very high RF performance, these instruments only adopted FFT techniques following the publication of Amendment 1 to CISPR 16-1-1 in June 2010. The company’s FFT-based ESU and ESR receiver models have been joined by the recently released ESW that, according to McCarthy, “… has real-time FFT analysis with approximately 600,000 FFTs/s and a 100% POI of 15 µs to assist with EMI diagnosis and troubleshooting of time-varying signals.”
Rigol Technologies offers an EMI option for the company’s DSA800 Series spectrum analyzers that provides a quasi-peak detector and 6-dB bandwidth 200-Hz, 9-kHz, and 120-kHz EMI filters. As described by the company’s Jason Chonko, applications engineer, “The DSA800 features an all-digital IF stage as well as a proprietary architecture that delivers an instrument with the low displayed average noise level and performance of a high-end analyzer in a small and affordable package.”
Standard capabilities include frequency response from 9 kHz to 1.5 GHz (DSA815), 9 kHz to 3.2 GHz (DSA832), and 9 kHz to 7.5 GHz (DSA875). Thanks to the digital IF, RBWs as low as 10 Hz are available in the two higher frequency models. Chonko added that the series includes AM/FM demodulation as standard, and there is an advanced measurement option with TOI, C/N, ACP, and other features typically used for TV and radio transmission testing. A tracking generator also is optionally available.
Near the top in terms of FFT speed is NI’s FlexRIO FFT implementation that runs on the embedded Xilinx Virtex-5 FPGA. The Xilinx Fast Fourier Transform v9.0 LogiCORE IP Product Guide discusses the many implementation options available to the developer and that can be selected/controlled via NI’s LabVIEW FPGA module. According to NI’s Chaudhary, the FlexRIO module “… computes up to two million overlapping FFTs/s. Spectral data is then visualized using both persistence and spectrogram displays.”
Overlapping FFTs are exactly what the term implies. As an example, if a block of data contained 1,024 samples, the first FFT would be performed on that data. The next FFT would be performed on some portion of the original data, say 800 points, plus the next 224, and so on, shifting by 224 new points each FFT. The effect is to increase the rate at which FFTs are being computed relative to the rate at which data is being sampled. This means that short events are less likely to be minimized by windowing: The event is more likely to become centered within a window and appear in one of the FFTs. Chaudhary doesn’t state the degree of overlap, which can be as large as all the previous data except the last point, which will be replaced by a new point. In this case, complete FFTs are being computed at the data sampling rate.
Conclusion
Do you need real-time spectrum analysis for your application? If you do, today there are a lot of instruments to choose among including modular customizable ones you build using NI’s Real Time Spectrum Analysis software. On the other hand, swept tuned analyzers have been used for a long time and remain appropriate unless you are likely to encounter transient bursts or need a VSA to demodulate signals. Why not buy a signal analyzer with all three—swept, VSA, and real-time capabilities? Instruments with combined functionality are available from several vendors and represent the current state of the continuing signal analyzer evolution.
References
- “Technical Innovations in the Keysight UXA Signal Analyzer,” Keysight Technologies, October 2014.
- Introduction to Digitize Function, Anritsu, Application Note, 2012.
- Understanding FFT Overlap Processing Fundamentals, Tektronix, Primer, August, 2009.
For more information


